create tabular views fast (riot)


Prerequisites
This post covers RiotJS (You shall see this if not aware of what RiotJS is)
What is this ?
A riot based component to build grid based UIs or tabular views in a faster and declarative fashion.
In my last project I was faced with the boring task of creating over 20 grids (with different data) at different pages of the app. I thought of making the boring task a little less boring by producing this component (powered by footable and RiotJS)
- Check out Getting Started with RiotJS for understanding how RiotJS components work.
- FooTable is a small and sweet grid rendering library (others are jqgrid, datatables, slickgrid)
What riot-fast-tables does ?
It renders grid controls based on the configuration you provide into it. It is made out to be 100% declarative to produce similar looking tables (across your project pages). you can customize the look and feel for the tables by tweaking the component markup itself.
The Code for the Example I used
The code I’m using is at gitlab
Feel free to extend the chain
How it works , configuration object ?
The configuration looks somewhat like below
{
       pagesize:"2",
       headdata:[
           {class:"text-center", label:"Name"},
           {class:"text-center", label:"Amount"},
           {class:"text-center", label:"Client"},
           {class:"text-center", label:"Due Date"},
           {class:"text-center", label:"Status"},
           {class:"text-center", label:"Actions"}
       ],
       tabledata: [
        {
            corp:{ name: 'Mike Gatting' },
            amount: '500',
            client:{ name: 'Andrew Slater' },
            due_date: new Date(),
            status: 'active'
        },
        {
            corp:{ name: 'Ravish Kumar' },
            amount: '300',
            client:{ name: 'Arnab Goswami' },
            due_date: new Date(),
            status: 'active'
        }
    ],
       rowitems: [{value:'corp.name'},{value:'amount', format: 'currency'},{value:'client.name'},{value:'due_date', format: 'date', pattern: 'DD-MMM-YY' },{value:'status'}],


       rowactions: [
                   {onclick:this.action_one,iconclass:"fa-envelope"},
                   {onclick:this.action_two,iconclass:"fa-eye"}
               ]
   }
Each part of the configuration described below -
pagesize: the number of rows visible on each pageheaddata: An array of objects containing each header column information.classthat can be applied to each heading column, andlabelthat can can be the header column text. this array size shall equal the number of columns visible.tabledata: An array of JSON objects each representing a row-data. An example of one row-item is
    {
      corp:{ name: 'Mike Gatting' },
      amount: '500',
      client:{ name: 'Andrew Slater' },
      due_date: new Date(),
      status: 'active'
  }
here, the actual data present shall be supplied. This is worked upon by using the rowitems data to fetch out and render each row in final output.
rowitems: This consists an array of JSON objects each of which represnts what value shall be fetched out of the original JSON object (each row object fromtabledataoriginal array)
A valid value looks something like
- {value:'corp.name'}
    which means fetch and render from path `<original_obj>.corp.name`
- {value:'amount', format: 'currency'}
    which means fetch and render `<original_obj>.amount` but before rendering format the string as `currency`
- {value:'u_date', format: 'date' , pattern: 'DD-MMM-YY' }
    which means fetch and render `<original_obj>.u_date` but before rendering format the value as `date` using the supplied pattern
rowactions: This consists an array of JSON objects each of which represents an action possible upon click of the icon presented. The icon to be rendered (usin font-awesome icons is also specified in configuration). The array is of JSON objects like -
{onclick:this.action_one,iconclass:"fa-envelope"},
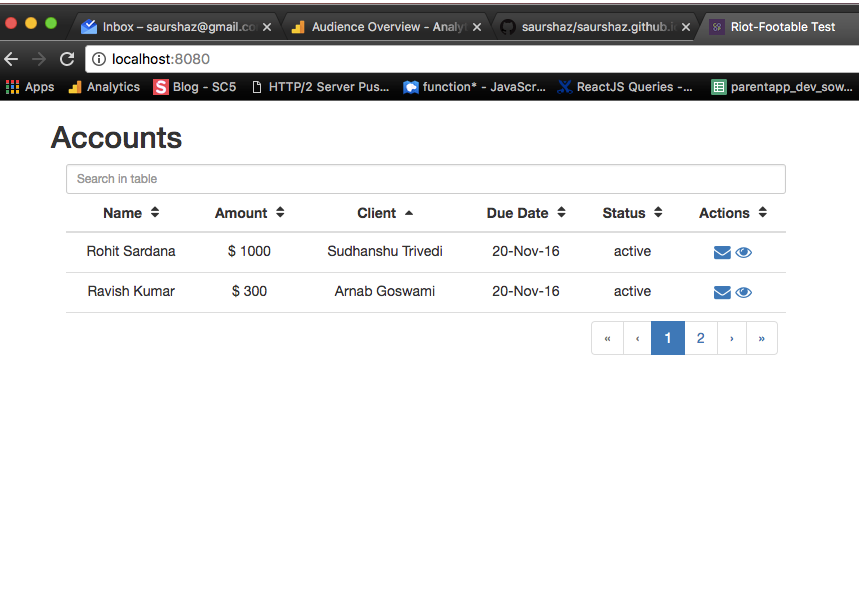
Here, action_one would be a function present in the current context. and iconclass represents to the style applied on the action-button. Look below for what rendered looks like -
The style is unusual, right ?
Yes it is imperatively building the grid. and this style will be slower than actual data grids (if data is already available). However this is a good fit for certain use-cases. where you want to abstract tabular rendering and change views at runtime. or places where developer productivity is more important and fastest grid is not the end goal.